Chart Annotations

Technical analysis of chart action.

UPST and NVDA Technical Analysis

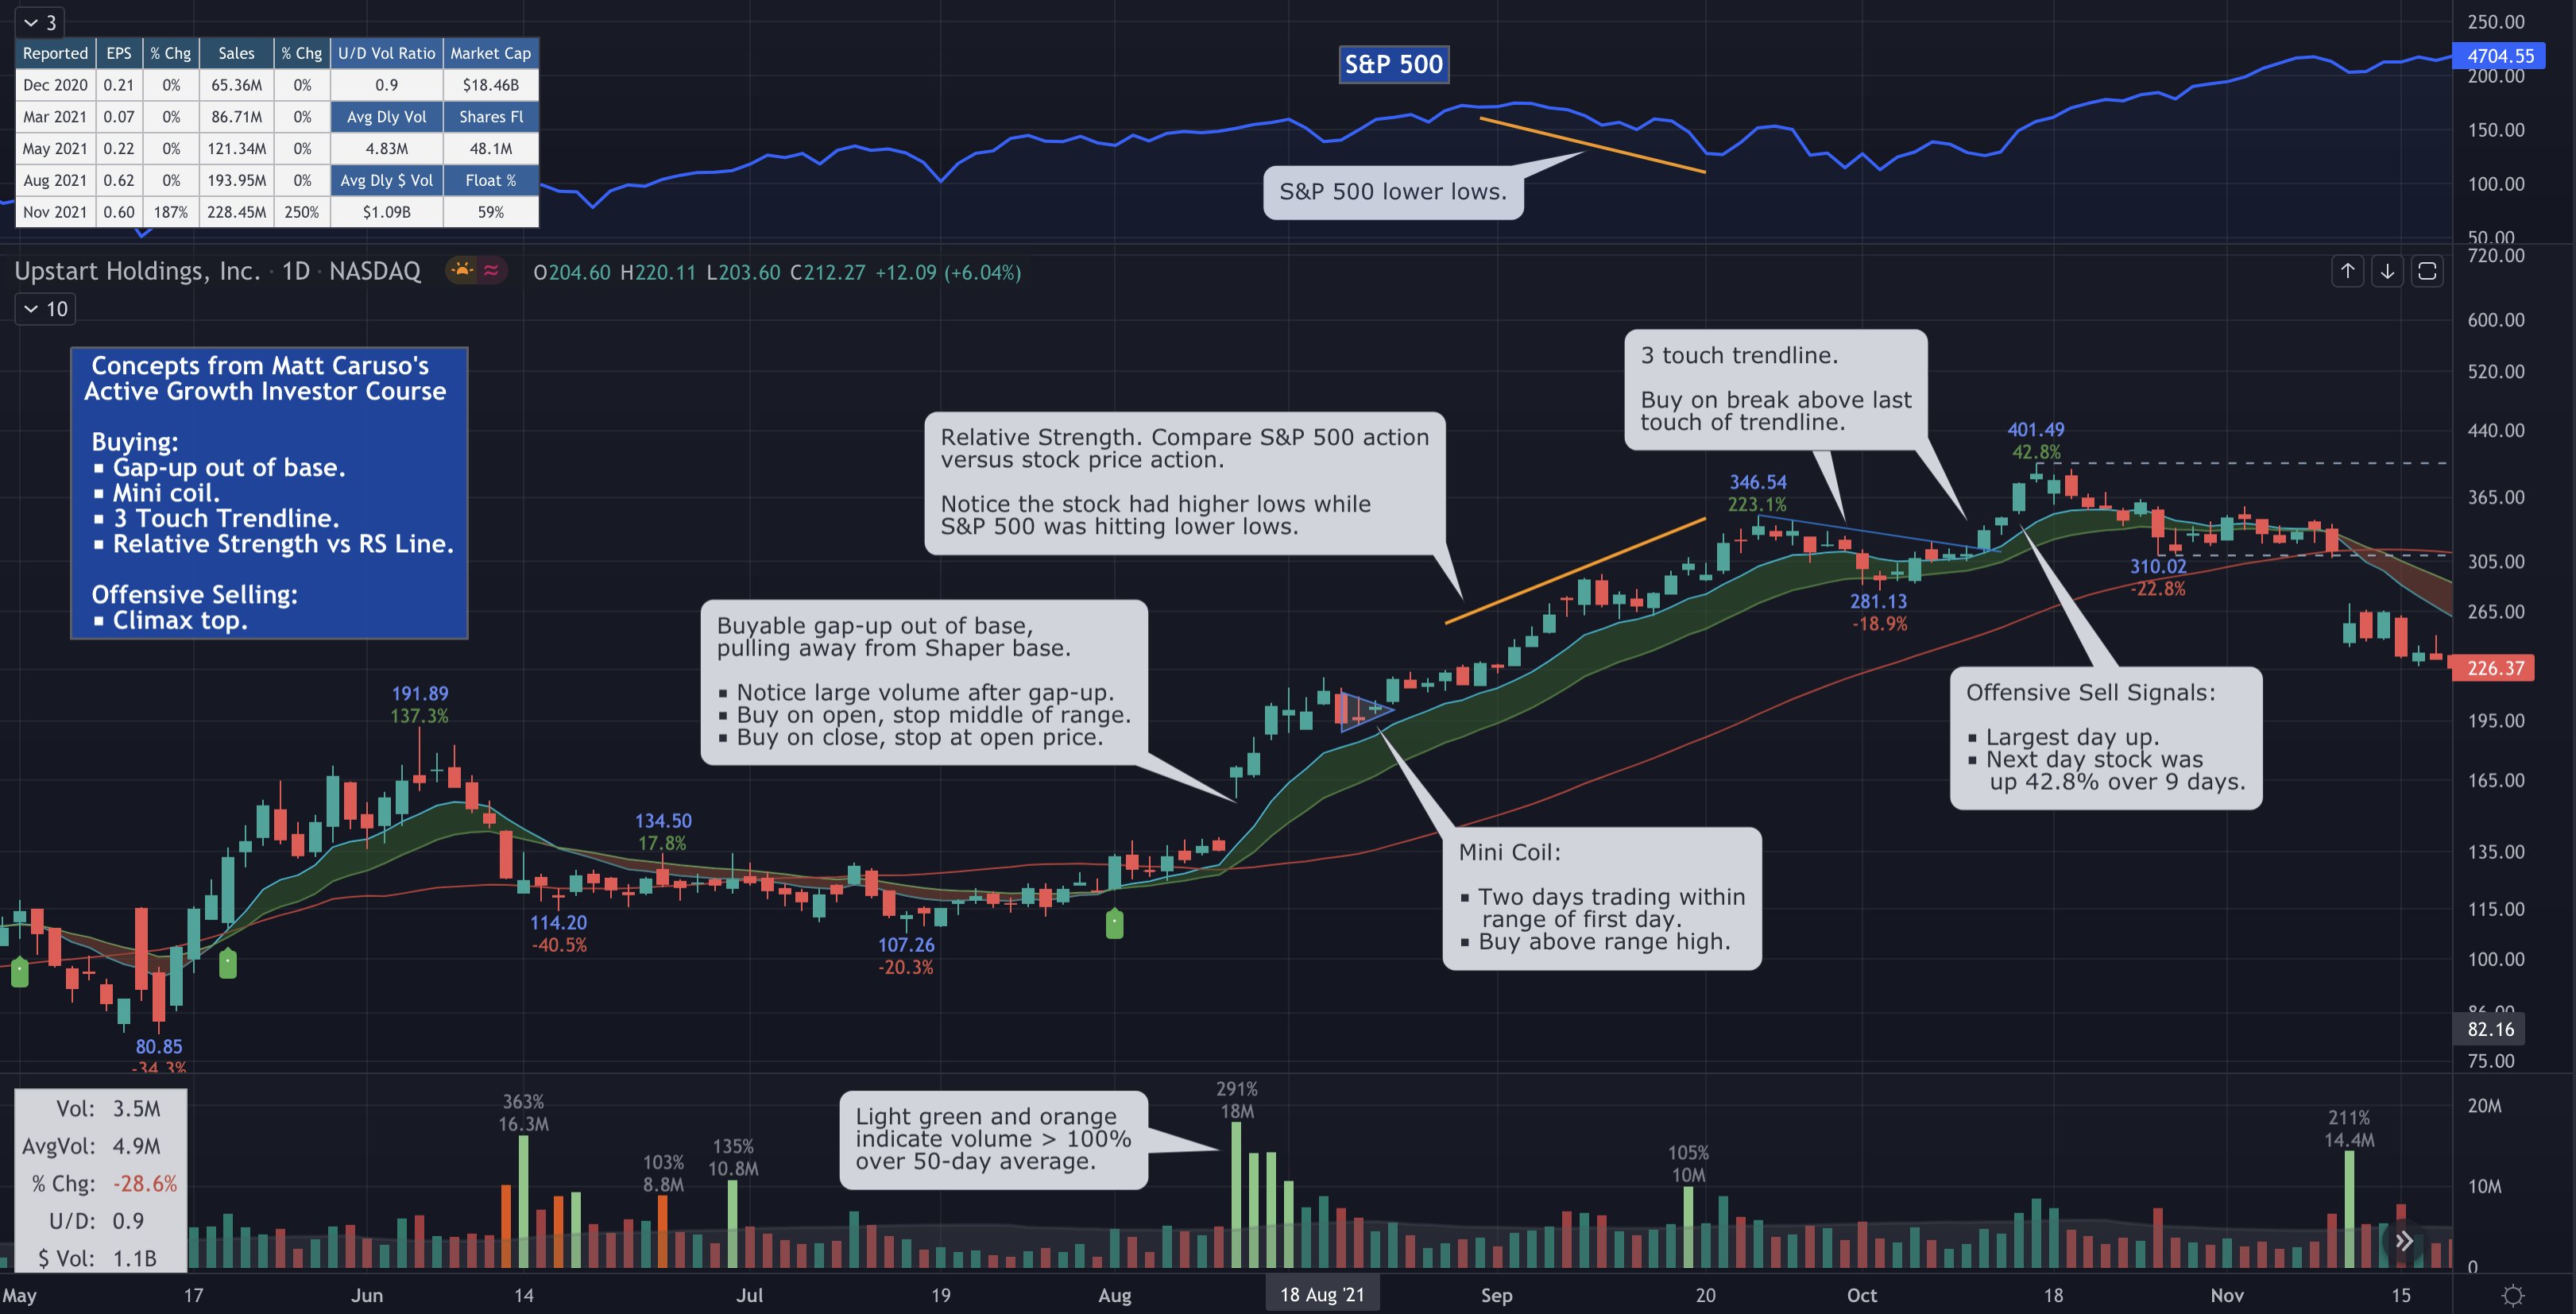
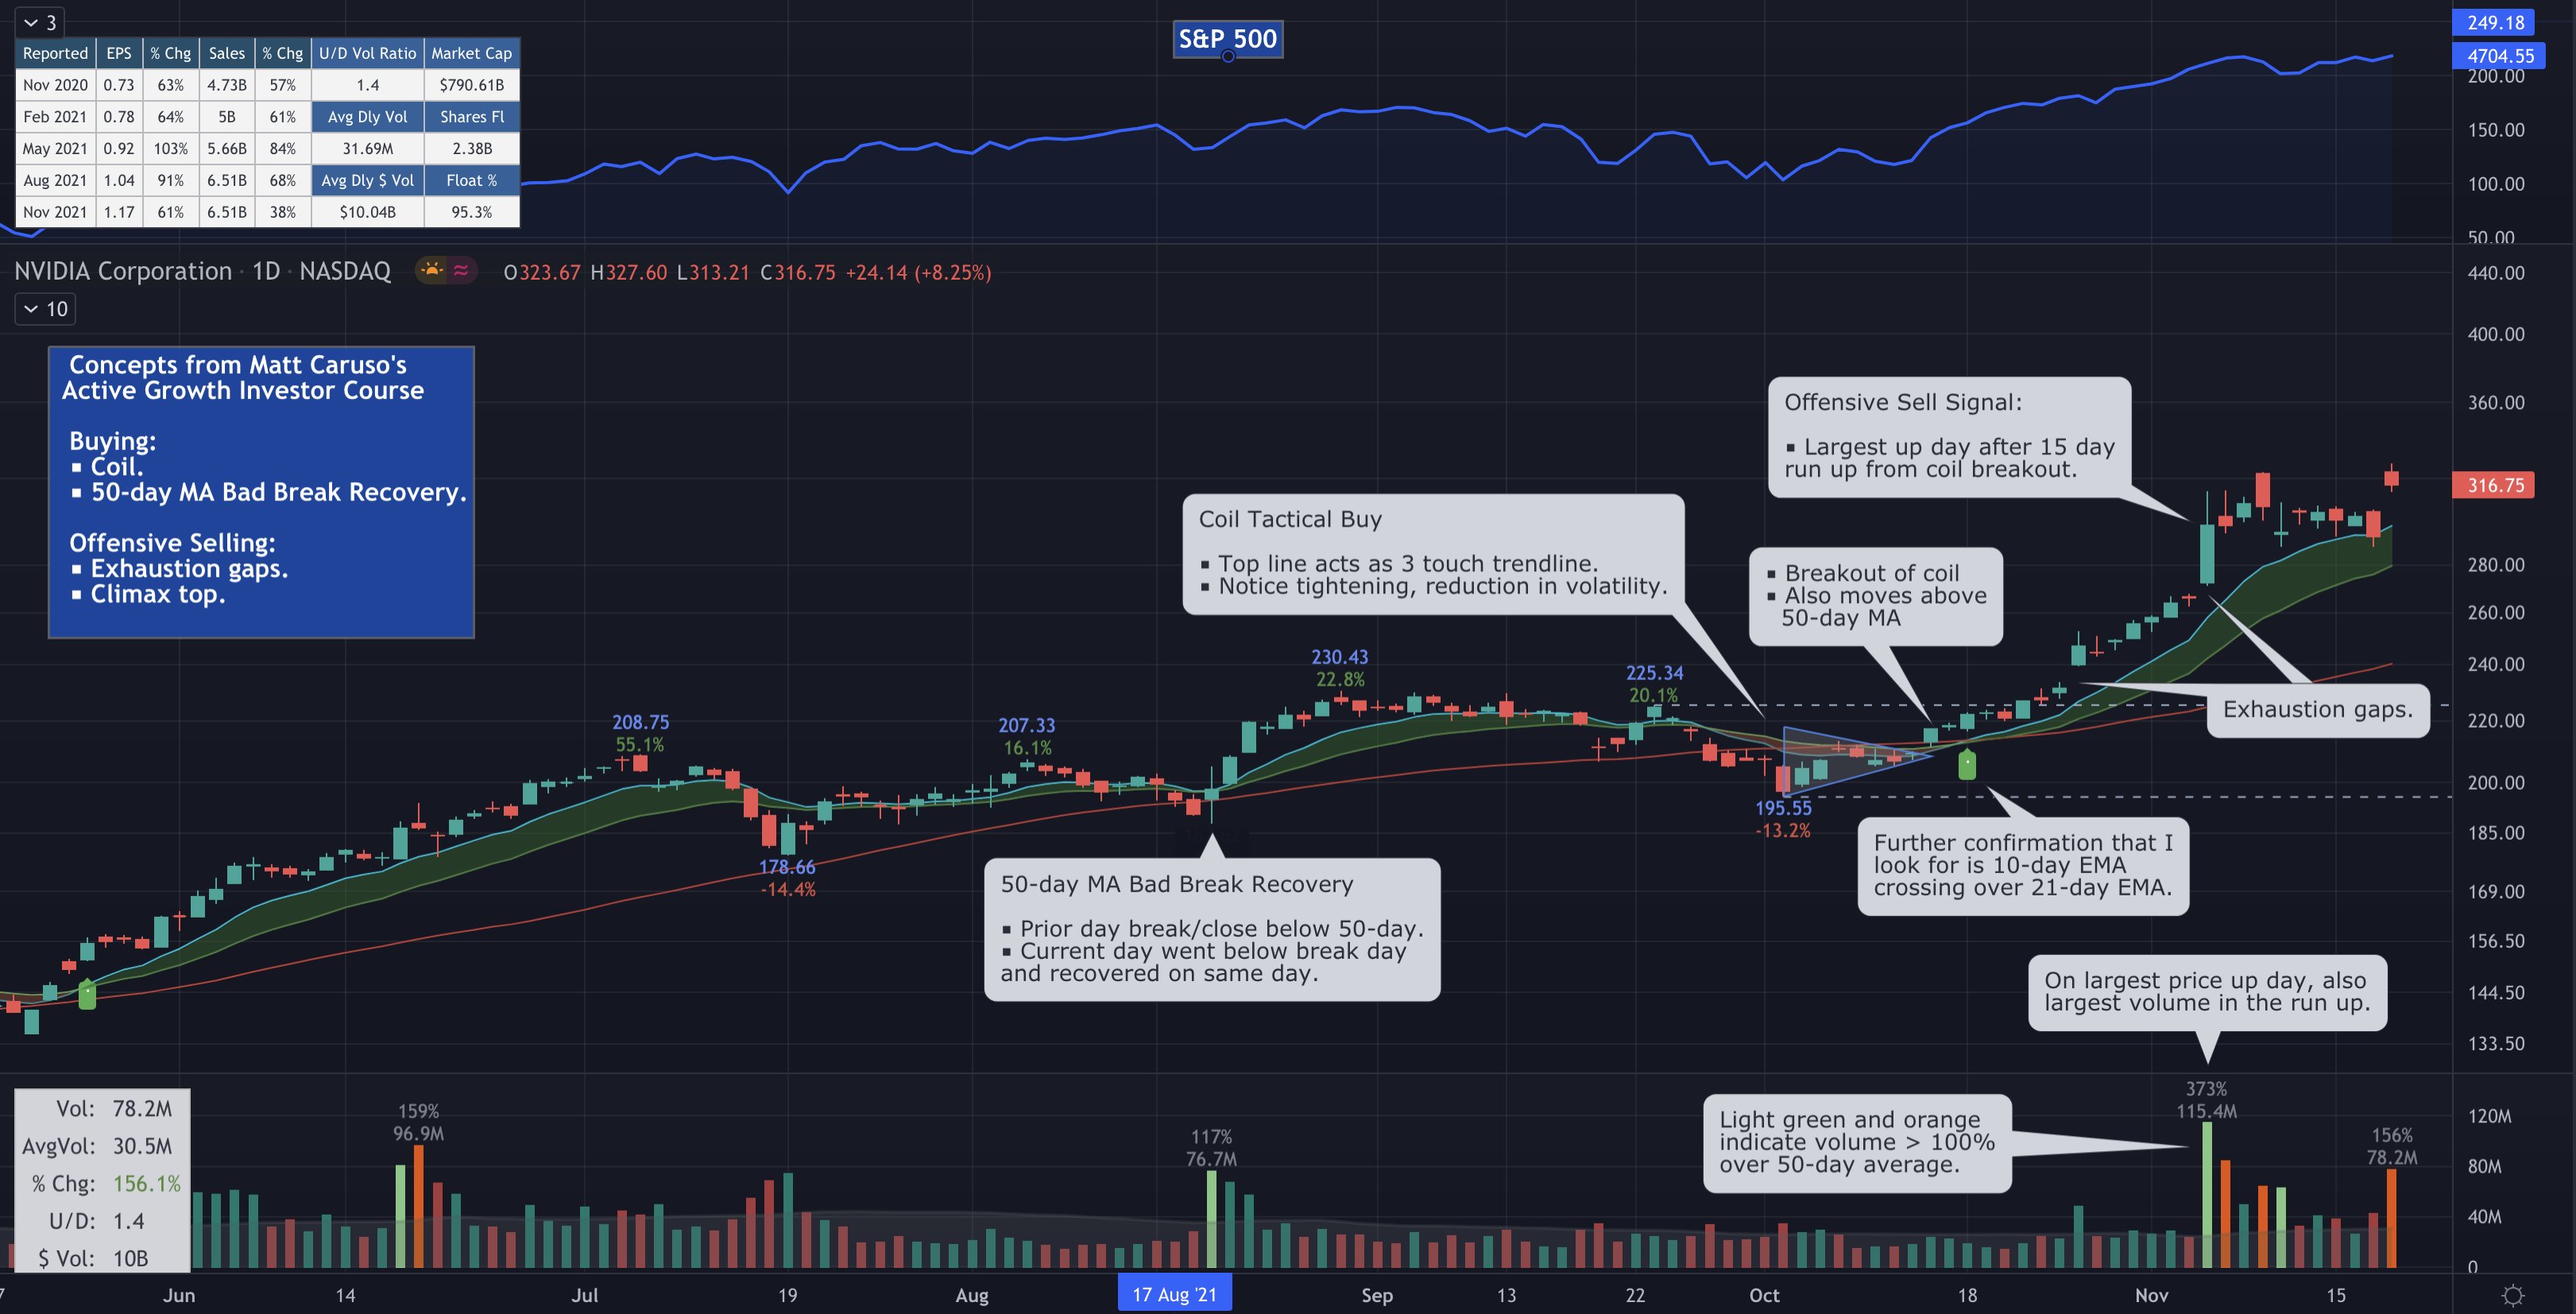
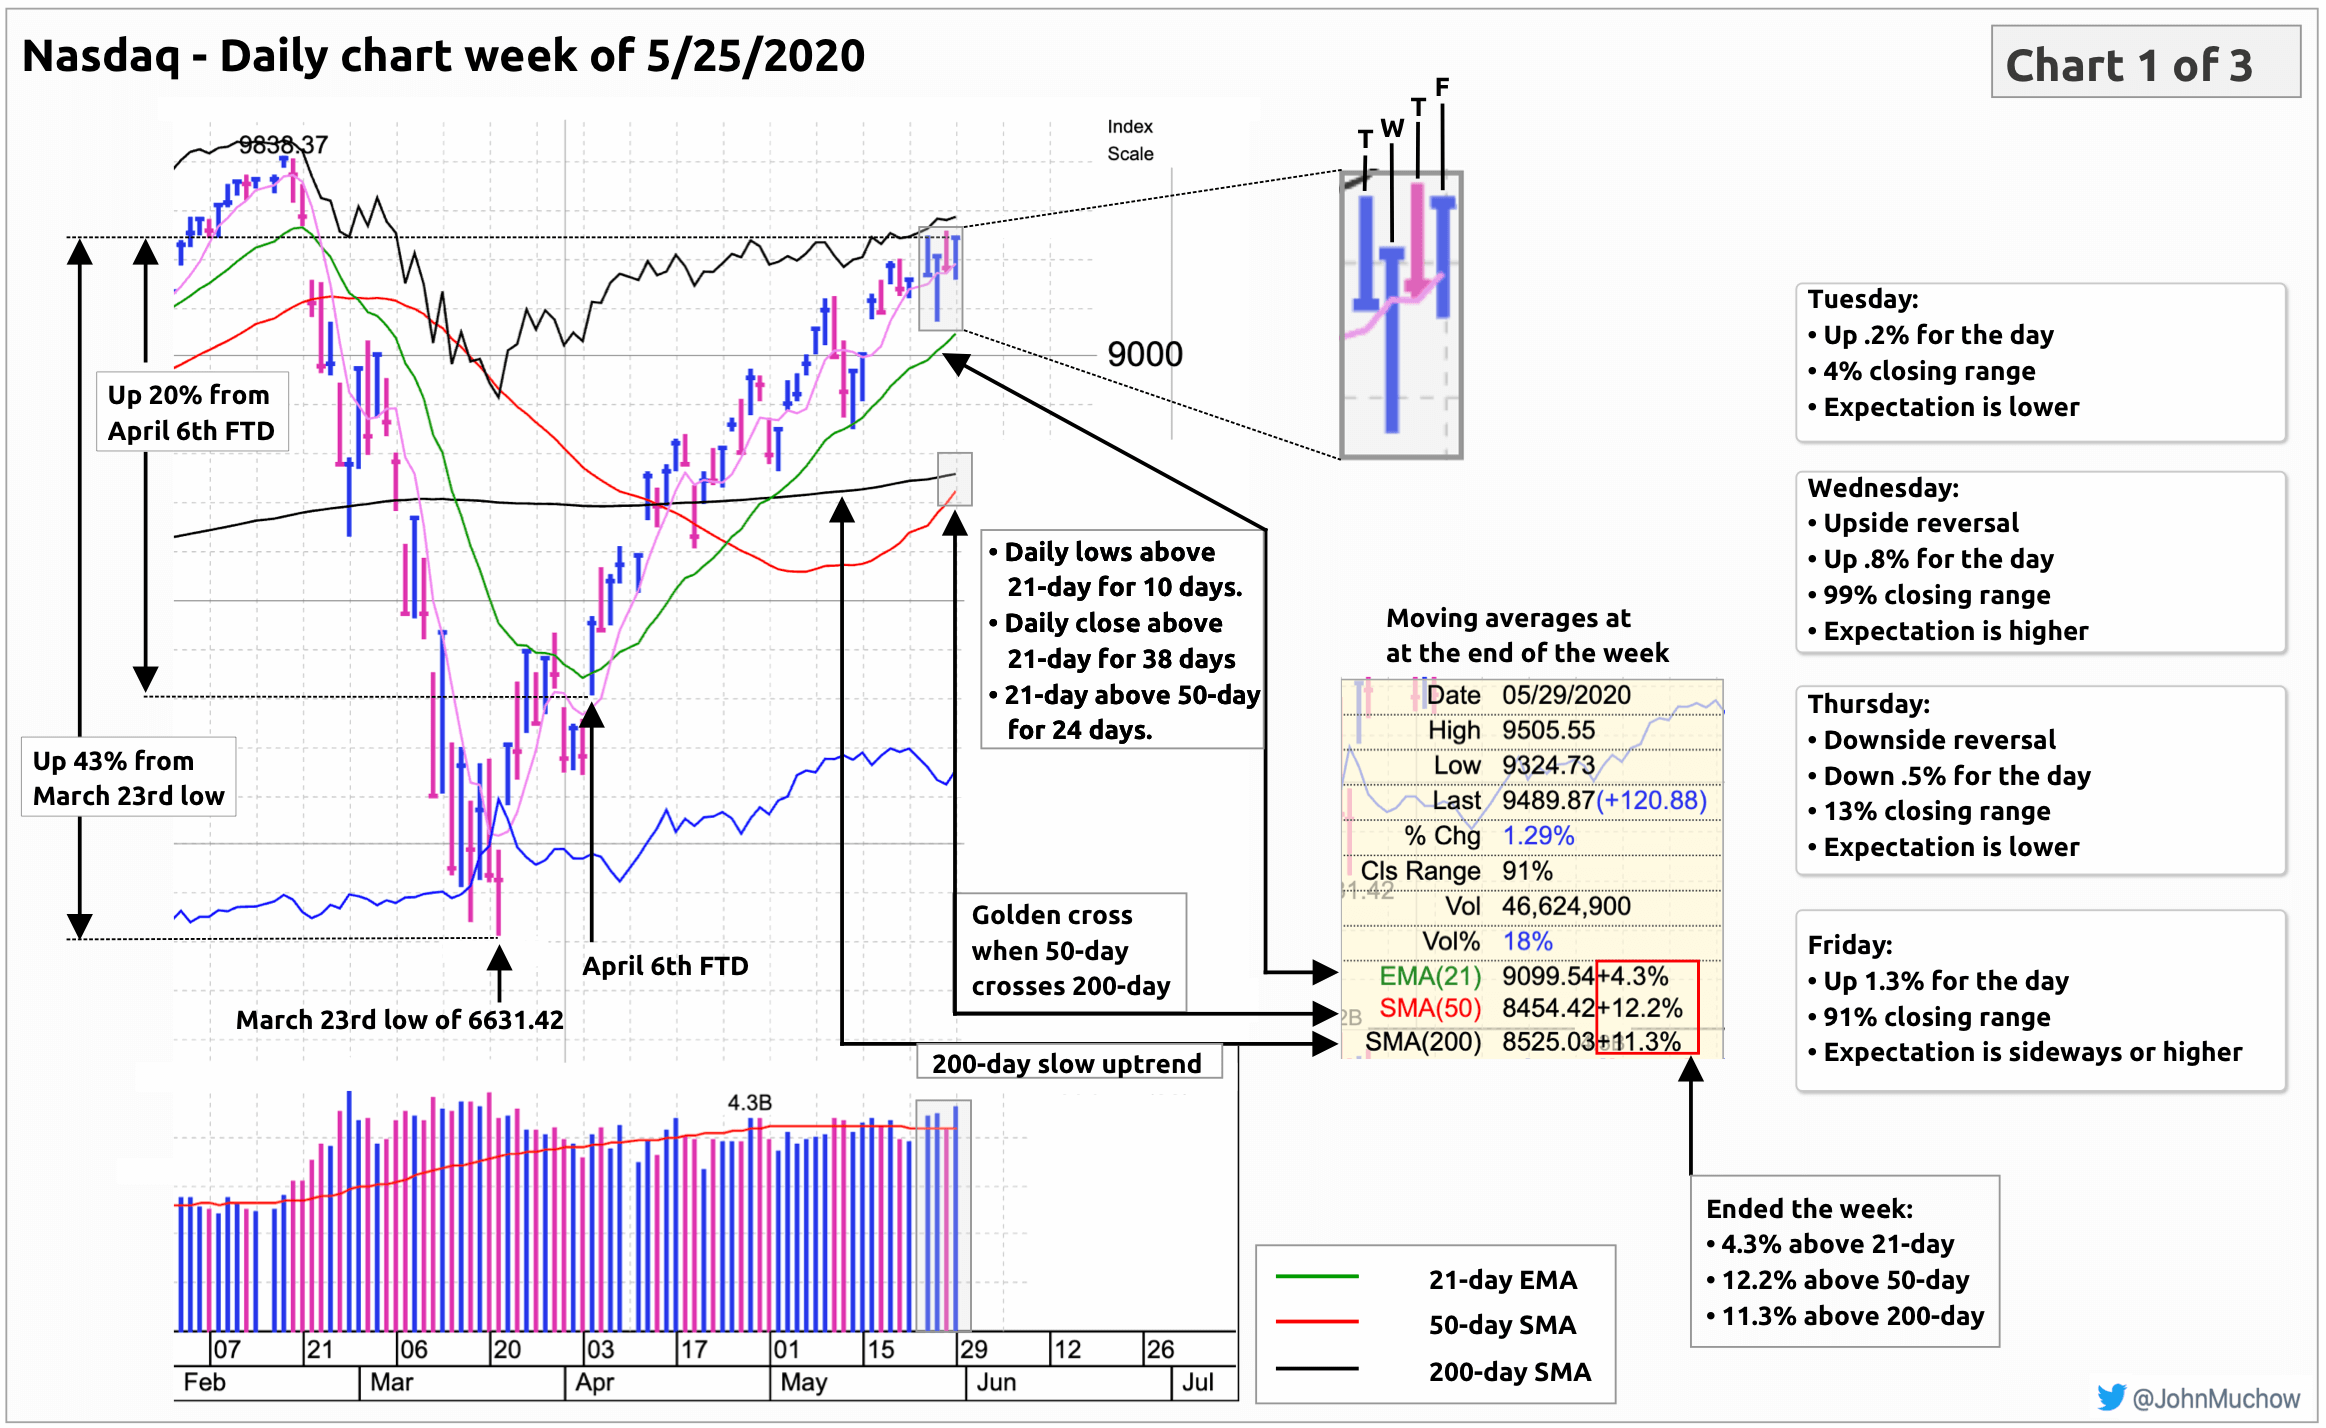
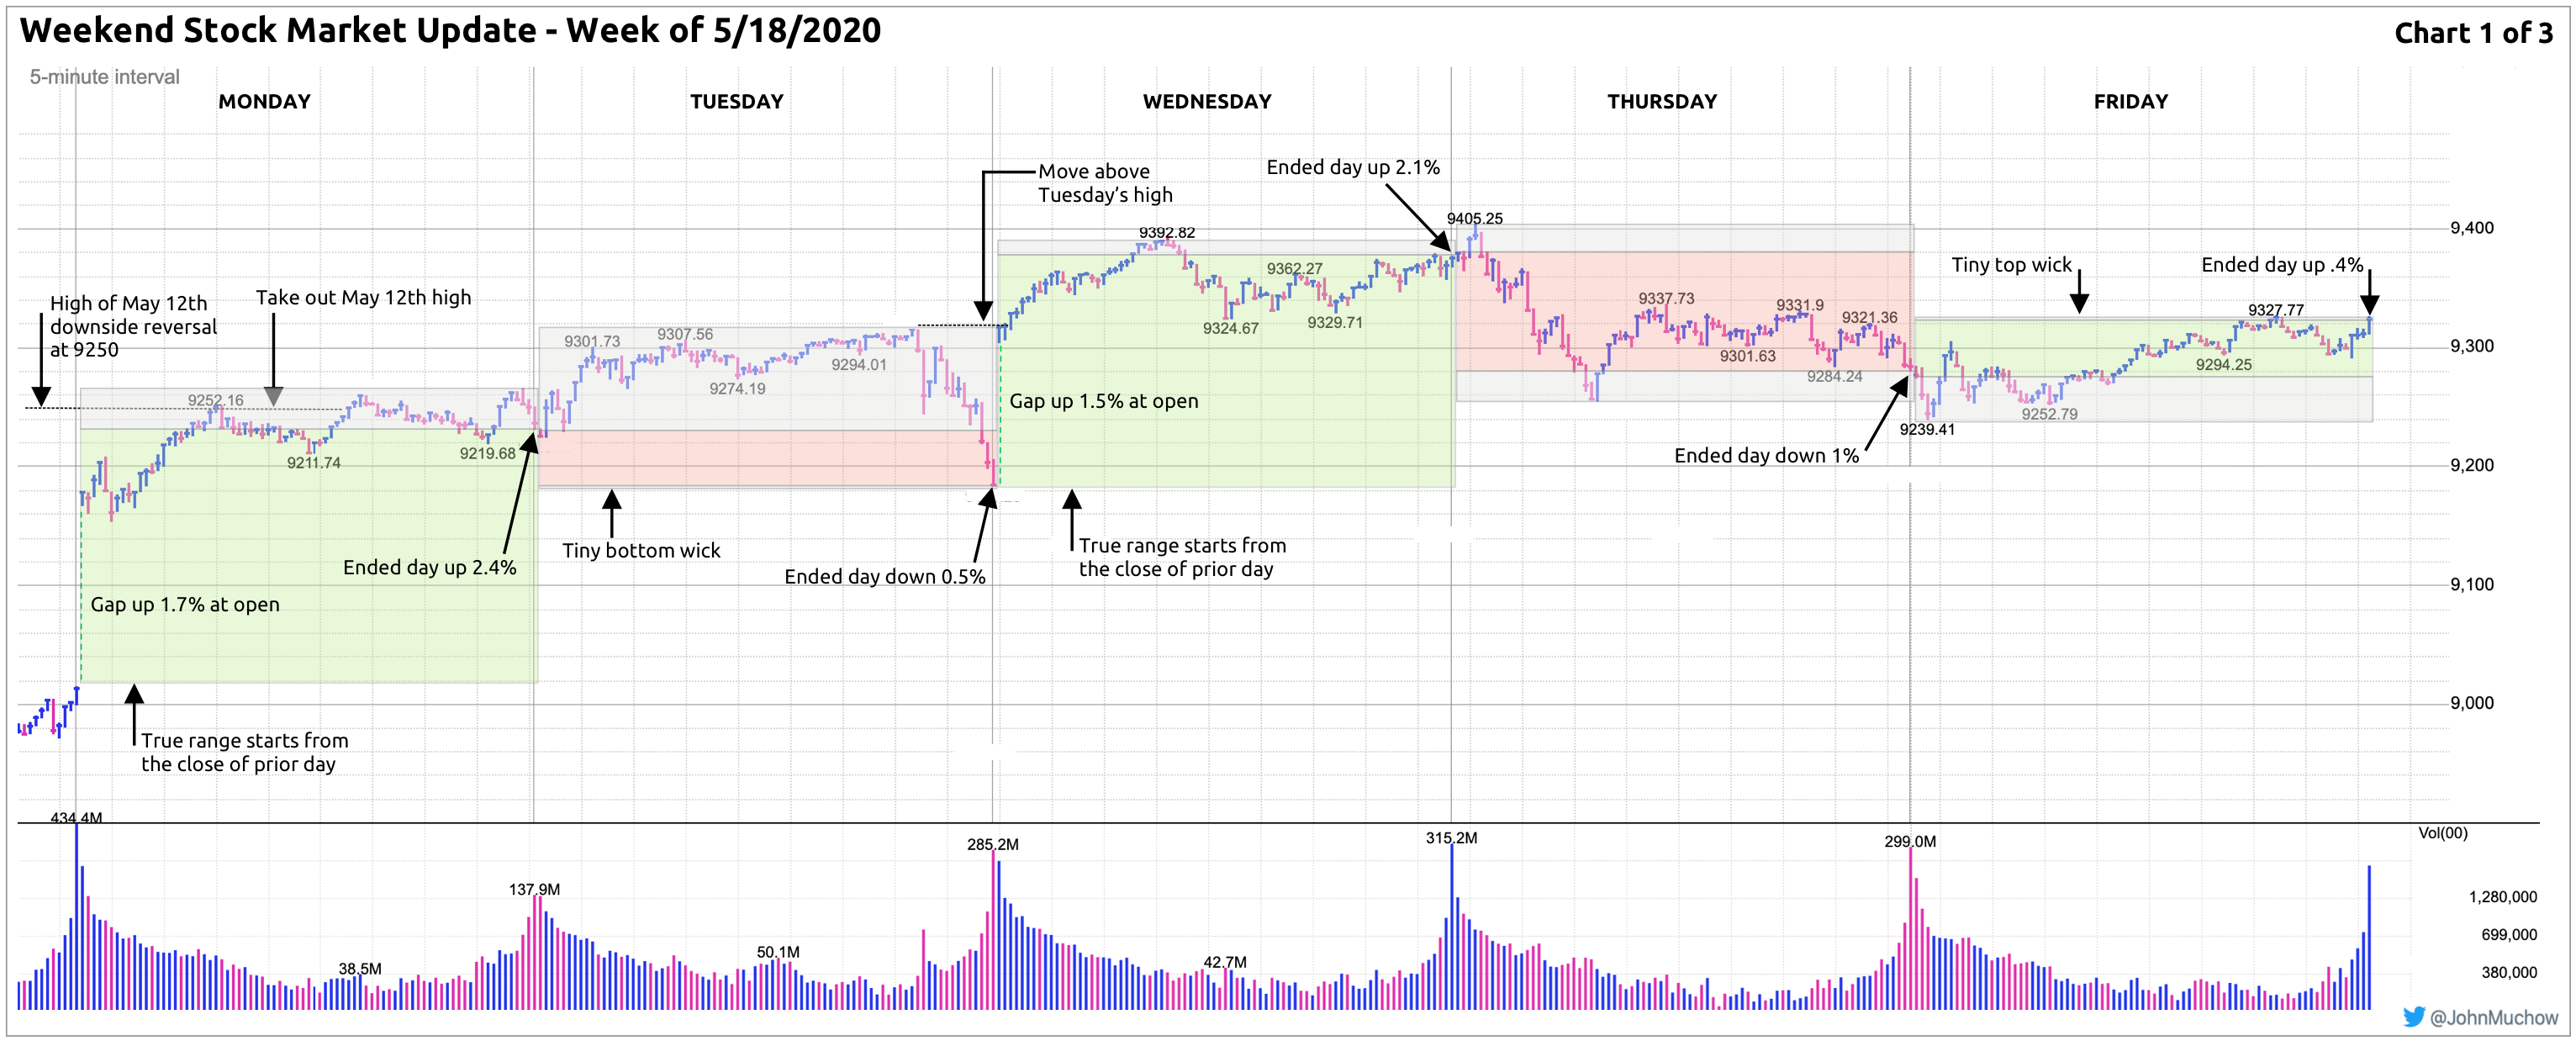
I’ve annotated two charts of Upstart (UPST) and Nvidia (NVDA) using technical patterns from Matt Caruso’s Active Growth Investor course. If you’re not familiar with Matt, he had an impressive 346% return in the U.S. Investing championship in 2020!

If you’re interested to master a comprehensive approach to trading, from mindset to fundamentals to technical analysis, I highly recommend you have a look at Matt’s Active Growth Investor course.

Continue reading

Stock Market Update Charts – Week of 7/13/20

Following are three charts based on @mwebster1971‘s stock market update The Raging Bull Vacation. Hopefully these will provide some additional visual context to the week’s technical action.

Continue reading

Stock Market Update Charts - Week of 6/29/20

Following are three charts based on @mwebster1971‘s stock market update The Raging Bull At New Highs. Hopefully these provide some additional context to the week’s technical action.

Continue reading

Stock Market Update Charts – Week of 6/22/20

Following are three charts based on @mwebster1971‘s stock market update The Raging Bull Battle. Hopefully these will provide some additional visual context to the week’s technical action.

Continue reading

Stock Market Update Charts – Week of 6/15/20

Following are three charts based on @mwebster1971‘s stock market update The Raging Bull’s Victory. Hopefully you’ll find the charts helpful as an additional reference.

Continue reading

Stock Market Update Charts – Week of 6/8/20

Following are three charts based on @mwebster1971‘s stock market update The Raging Bull Avoids A TKO. Hopefully these will provide some additional visual context to the week’s technical action.

Continue reading

Stock Market Update Charts - Week of 5/25/20

The following three charts are based on @mwebster1971‘s Weekend Stock Market Update, The Raging Bull Rests.

The first chart focuses on the daily activity as well as a summary of the moving averages at the close of the week.

Continue reading

Stock Market Update Charts - Week of 5/18/20

Following are three charts that you can use as a visual reference for @mwebster1971‘s Weekend Stock Market Update for the week of 5/18/2020.

The first chart shows the 30,000 foot view of the week’s activity. I’ve highlighted the chart with colors to emulate a candlestick look on top of a 5-minute chart.

Continue reading