MonthDecember 2020

RS Line vs RS Rating - What’s the Difference?

A common question regarding MarketSmith: what is the difference between the RS Line and RS Rating?

I originally wrote a short post describing the differences (see below). The video tutorial that follows provides some additional insight as well as highlights several examples on how to use both indicators when scanning for growth stocks.


Continue reading

How to Trade Like an Investing Champion - Annotated Chart

Investor’s Business Daily recently hosted a webinar How to Trade Like an Investing Champion. The moderator, Irusha Peiris, was joined by U.S Investing Champions David Ryan (1985, 1986 and 1987) and Mark Minervini (1997). This is an excellent webinar to get insight into how these award winning traders analyze both the market and stock setups.

Continue reading

Divergence and True Market Leaders

One sign of a potential true market leader is when there is a divergence of the stock’s price action versus the overall market. In this post I’ll show several examples where the S&P 500 was moving down while a stock was moving up, preceding a large gain over the coming months.

As with any technical or fundamental indicator, divergence is no guarantee of upward price movement. However, as you’ll see, divergence may be foretell a winning stock, one that can make a significant move higher.

Continue reading

Webby’s RSI for TradingView in Pine Script

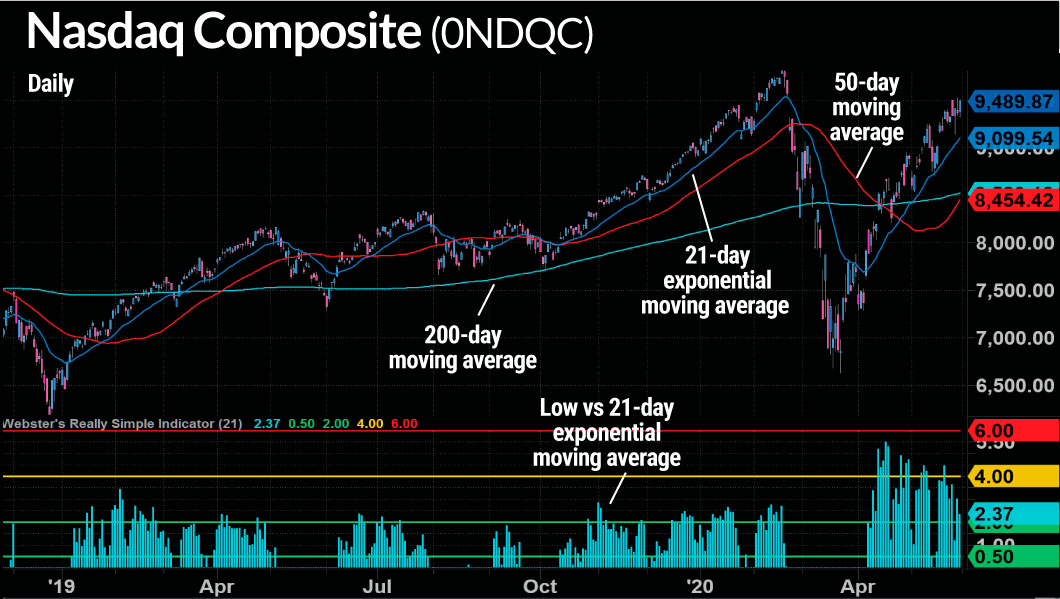
Webby’s RSI (really simple indicator) is a technical indicator to gauge the health of an uptrend. The concept of Webby’s RSI and the original implementation was created by Mike Webster. In this post I’ll share a Pine Script version of Webby’s RSI that you can use on TradingView.

Webby’s RSI, most often used with the Nasdaq Composite, is the percentage of the low vs. the 21-day moving average. At the beginning of a bull market, the higher the value, the better.

If you are familiar with TradingView and would like to install the indicator, you can find Webby’s RSI here.

Before we get into the code, here’s how Webby’s RSI looks as originally developed by Mike:

Continue reading

Closing Range vs True Range - What’s the Difference?

One way to help judge supply and demand for a stock is to pay attention to the closing range, which indicates where a stock closed within the price range for the day/week/month. Closing near the high indicates buyer demand for the stock. When near the bottom of the range, there was more selling than buying.

Closing Range Considerations:

• The closing range indicates where in the range (day/week/month) a stock closed.
• Higher in the closing range, buyers were in charge. More sellers than buyers when lower in the range.
• A closing range of 40%+ is supportive action.
• Even if a stock closes down for the day, if the closing range > 40%, that is still considered a sign of strength.

The true range takes into account the previous daily or weekly close. This provides another perspective as it relates to the current action, accumulation or distribution as well as the overall trend. The examples below will provide more specifics.

Continue reading

Follow-Through Day Tutorial with Examples

When there is a market correction, it’s important to wait for a confirmation that an uptrend is underway before scaling back in. A follow-through day is the signal we are looking for.

Below is a short tutorial on how to determine when a follow-through day (FTD) has occurred. This includes the required rally days prior to an FTD as well as early signs a failure may occur. You’ll also find several annotated charts showing an index low, how to track the prerequisite rally and pinpointing where an FTD begins.

Many thanks to Mike Webster for clarifications and updates.

Continue reading

Set Alerts at Profit and Loss Shaded Areas

Here’s a MarketSmith tip on how to quickly set an alert at the shaded areas indicating profit or loss. The primary benefit of the approach I’ll show below is that MarketSmith will do the math to determine the price for the relevant gain or loss.

As a reminder: The blue shaded area is 0 to 5% above the pivot price. The profit target, green shaded area, is 20%+ above the pivot. The red shaded area is 5%+ below the pivot.

Begin by moving your mouse over a shaded and right-click. A small pop-up will appear with the text Set Alert. Tap on the pop-up and a dialog with the alert price will be shown. Tape Done to set the alert.

Continue reading