


When there is a market correction, it’s important to wait for a confirmation that an uptrend is underway before scaling back in. A follow-through day is the signal we are looking for.
Below is a short tutorial on how to determine when a follow-through day (FTD) has occurred. This includes the required rally days prior to an FTD as well as early signs a failure may occur. You’ll also find several annotated charts showing an index low, how to track the prerequisite rally and pinpointing where an FTD begins.
Many thanks to Mike Webster for clarifications and updates.
Rally Attempt Prior to the Follow-Through Day
The basic idea of a follow-through day is simple: it’s a signal that there is enough momentum to get back into the market. It all begins with a rally attempt.
A rally attempt, over four or more days, must occur before a follow-through day is declared.
Rally Day 1 occurs upon one of the two following events:
- A major index closes up from the previous session.
- A major index closes down slightly from the from previous session, however, it closes in the top 50% of its daily range.
In either scenario, we don’t concern ourselves with daily volume or the amount of the gain. The second option above is known as a pink rally day, as MarketSmith shows the day as a down day (in pink).
Rally Days 2 and 3: For the rally to stay alive, the intraday low of days 2 and 3 must not go below the low of the first rally day.
Rally days do not need to close higher than the previous rally day.
Rally Failure
If intraday, any rally day goes below a previous rally day low (not necessarily Day 1), the rally fails. At this point, the process starts over, waiting for a Day 1 rally.
Follow-Through Day Requirements
Beginning on the fourth day or later, a follow-through day occurs when:
- One of the market indexes has a significant move up.
- The price gain is at least 1.25%.
- The move up is on volume higher than the previous day.
Volume on the follow-through day simply has to be higher than the prior session, not necessarily above the 50-day average volume.
Important notes: Although specifics are outlined above, these are guidelines. Declaring a FTD is not an automated process, it’s a collaborative effort by the team at Investors.com.
Follow-Through Day Examples
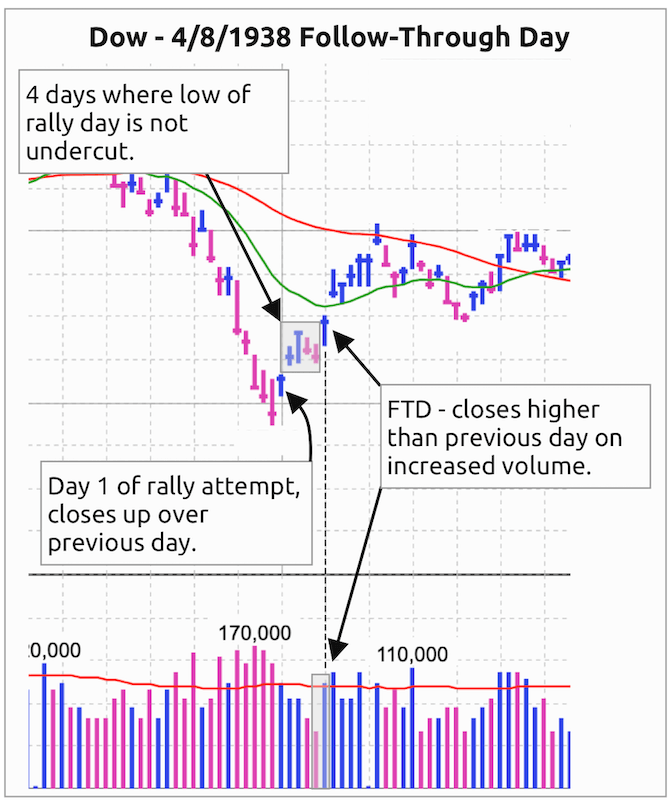
A classic follow-through day example is on the Dow, back in 1938. On the sixth day of the rally attempt, the Dow moves higher on volume that is greater than the previous day.
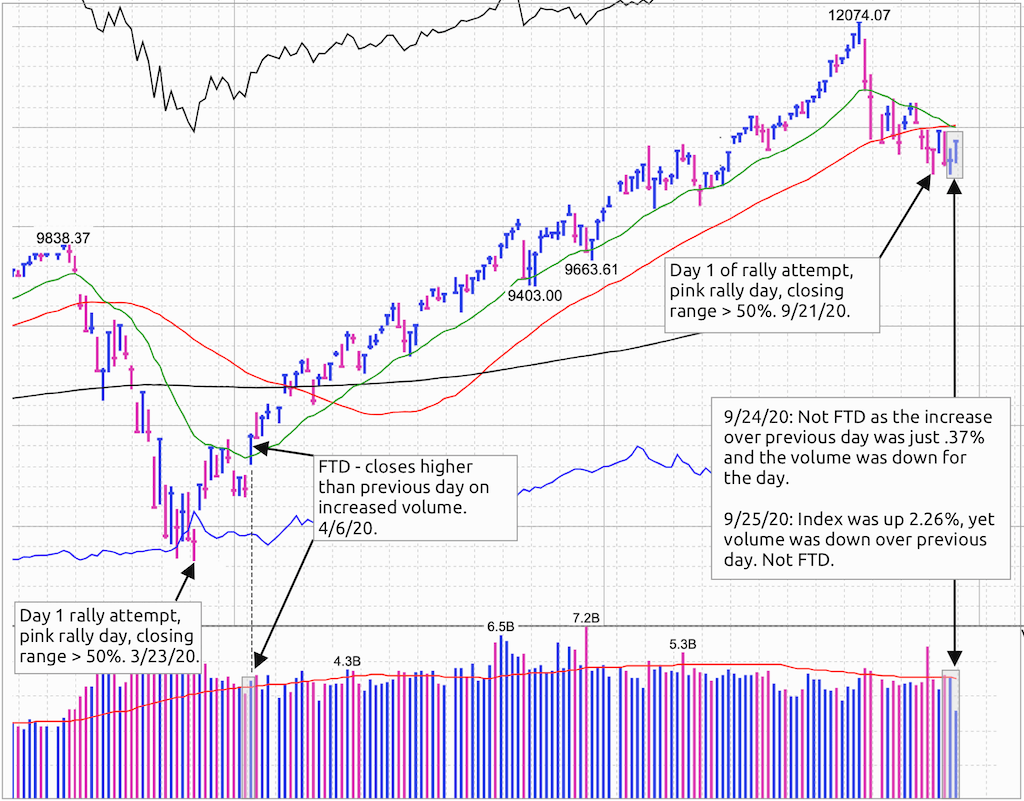
The following chart shows an example FTD from earlier in 2020, as well as the current rally attempt (as of 9/25/20).
Follow-Through Day Early Signs and Failure
FTD Early Signs
- Undercutting the low of the FTD intraday is okay.
- Closing below the low of the FTD is an early sign it may fail, you may choose to use this as a sell signal.
In the case of #2, if there is an additional FTD where the close of that FTD is above the low of the previous FTD, you may consider that a buy signal.
FTD Failure
If the index makes a new low, below the low where we started looking for a Day 1 rally, the FTD has failed. This is a sell signal.
Getting Back into the Market
Although you need follow your own style and risk tolerance, here’s a basic guide you might consider as it relates to market exposure after a follow-through day.
- On the follow-through day, increase (or start) exposure to the market.
- Increase exposure as the market closes above the moving averages. For example, a close above the 50-day and the 21-day moving averages would be logical places to add/buy.
Another positive sign is when you see an increase in the number of stocks that are breaking out of traditional pivots.
One last thought: In addition to buying market leaders, one idea to consider is an ETF such as QQQ, which seeks to track the performance of the Nasdaq 100. With this approach you can get market exposure without relying on an individual stock’s performance. If the market continues to improve, move out of QQQ and further into individual stocks.
Additional Information
What Is An FTD?
Stock Market Crash Always Precedes This Signal Of A New Market Bottom
Why You Should Buy On The Stock Market FTD
How To Find The Next Stock Market Bottom
Join the Discussion on Twitter:
I’ve been meaning to share my notes on Follow-Through Days since @mwebster1971 channeled Tom Petty back in April of 2020 as the FTD that won’t back down. I hope you find this information helpful. @IBDInvestors @MarketSmithhttps://t.co/yXBHc6nC5F
— John Muchow (@JohnMuchow) September 25, 2020