


A position size calculator can help you focus on fundamental and technical analysis without getting bogged down in repetitive tasks such as determining the number of shares to buy and the resulting position size. Let me explain.
Before I enter a trade, there are a few things I always know up front: how much I am willing to risk as a percent of my equity, where my original stop will be set, and my first target to consider taking profit (full or partial).
As far as a stop, based on my research of previous chart patterns as well as my own trades, I often find that a break of a moving average is a good place to consider a stop.
Up to this point I’ve been using a simple spreadsheet to do the math. My risk tolerance is usually fixed and I get the moving average prices from a chart. With a few simple calculations, I can quickly determine the number of shares to buy, the cost of those shares, my risk as a % of equity as well as the distance to the stop as a %.
This is where the calculator comes in. Charting software, such as thinkorswim, can easily determine the value of a moving average. If you provide the amount willing to risk and portfolio size, all the stats can be calculated and displayed.
One last note on when a calculator may be helpful. There are times when a moving average is simply too far away to make for a reasonable stop. For example, a stock’s price may be 10% or more away from a moving average, yet the stock may otherwise make for a good risk/reward tradeoff. In a scenario such as this, if you keep the amount you are willing to risk the same, you can consider a stop that is greater than the traditional 7-8%. The calculator will account for a larger stop % by reducing the position size.
Caveat: the web-based version of thinkorswim does not support thinkscript. You will need to use the desktop app to view the calculator.
Here’s How the Calculator Works
From the 30,000 foot view:
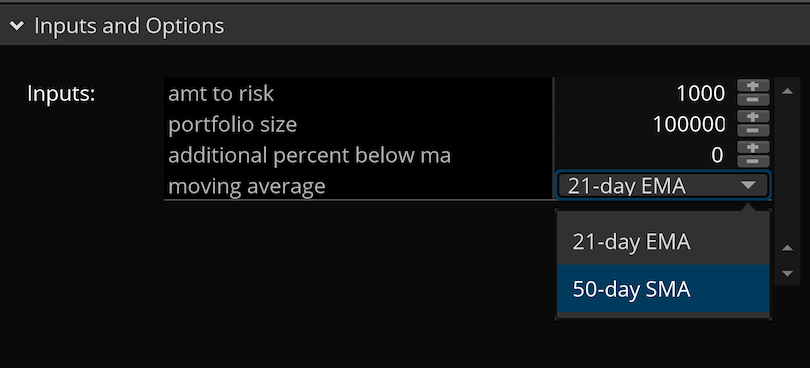
- If you are viewing a daily chart, the calculator will use either the 21-day EMA or the 50-day SMA, based on which moving average you select in the configuration settings (see below).
- If you are viewing a weekly chart, the calculator will use the 10-week SMA.
- You will need configure the amount to risk on each trade in $ (e.g. $1,000).
- You can specify a portfolio size which will allow the calculator to display your position size and risk as a % of equity.
- There is an option to set a % below the moving average as your stop. See below for more information.
Important note:
If a stock price is below the relevant moving average, the calculations can result in some rather confusing numbers. To work around this, the calculator does not display any information if a stock is not at least 2% above the moving average.
Configuring the Position Size Calculator
The figure below shows the thinkorswim Input and Options dialog and the configurable options..
As far as the moving average drop-down, when you are viewing a daily chart, this option specifies which moving average you prefer to use. I could have opted to show the data for both moving averages on the chart, however, thinkorswim has limited formatting options and it often wraps at a point that makes for a confusing display.
See the section below that describes in more detail how to use the option additional percent below ma.
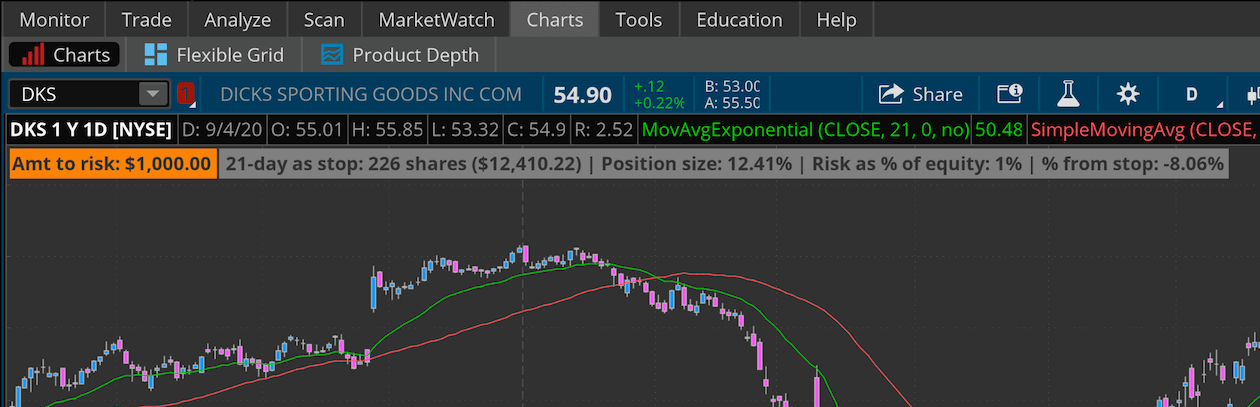
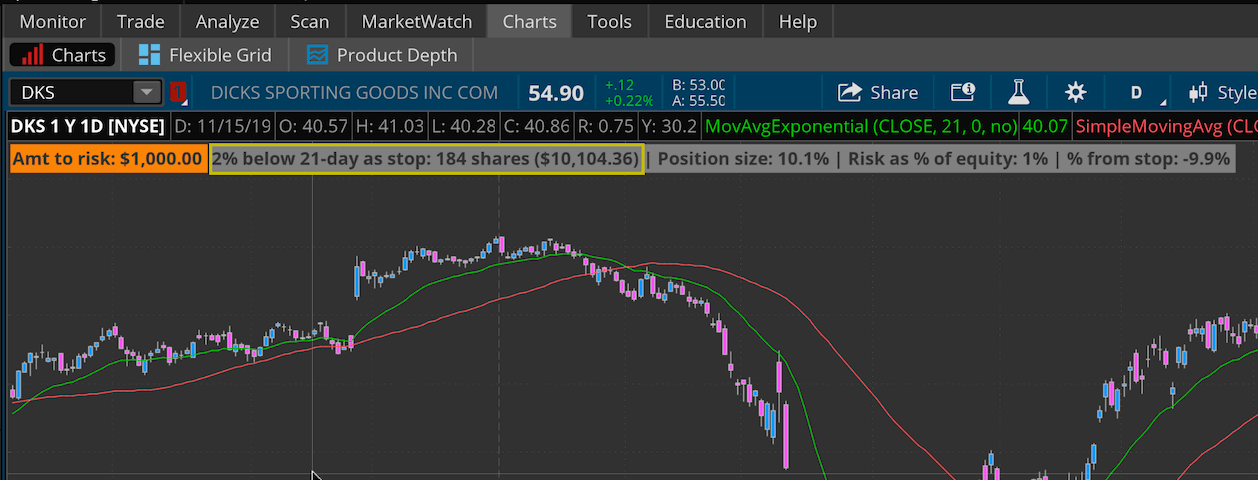
Using 21-Day Moving Average as Stop
If you configure the moving average option to use the 21-day EMA when you are a daily chart, you will see output similar to the following:
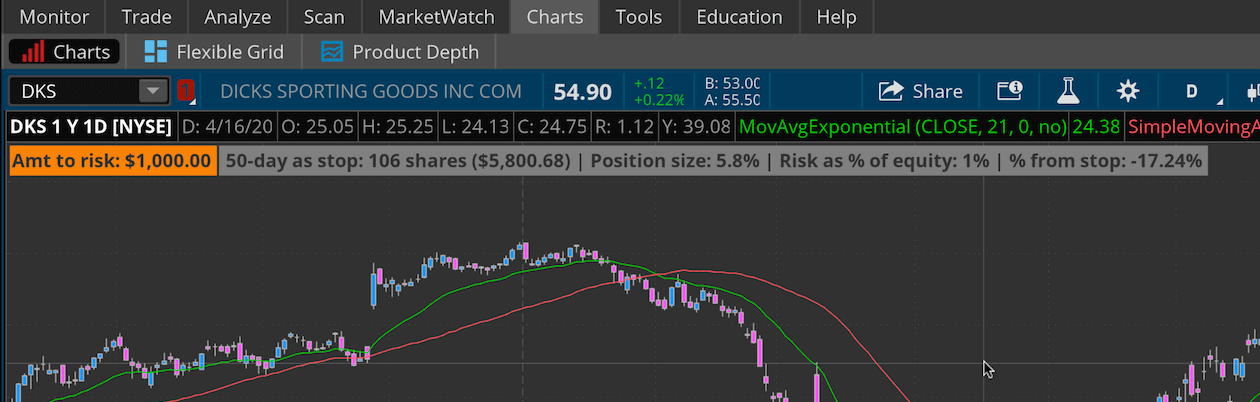
Using 50-Day Moving Average as Stop
If you prefer to use the 50-day SMA when viewing a daily chart, here’s how things will look:
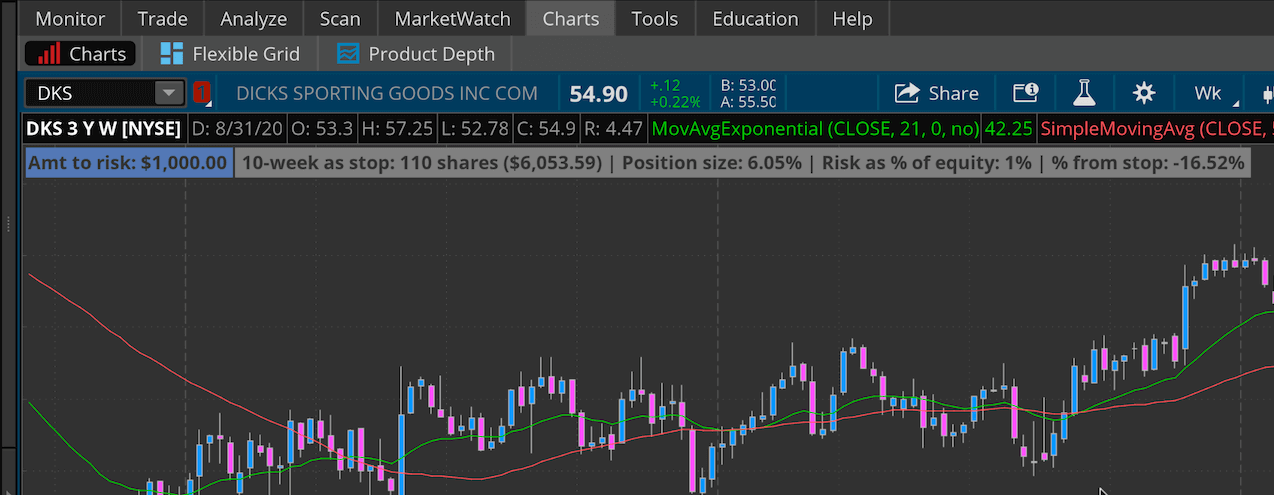
Using 10-Week Moving Average as Stop
When viewing a weekly chart, the calculator will use the 10-week SMA:
Specifying an Additional Percent Below a Moving Average
The option to specify a moving average for a stop is handy, however, it’s a common place for a stop, hence, you may get bumped out of your position more often than not.
As an alternative, you may find a decisive move below a moving average may offer a little more breathing room and at the same time make for a stop that’s not as obvious.
For example, if you set the additional percent below ma option in Inputs and Options dialog to 2, the calculations are based on a value that is 2% below the moving average. Unfortunately, thinkorswim does not seem to allow fractional values in the configurable options, so you will be constrained to using whole numbers.
Why Don’t I See Any Information Displayed?
As mentioned above, the calculator does not display any information if a stock is not at least 2% above the moving average.
Installing the Position Size Calculator in thinkorswim
If you have thinkorswim installed, click here to install the position size calculator from the thinkorswim Sharing Center.
You can also copy/paste the link into thinkorswim’s Open Shared Item feature, the link is: https://tos.mx/E8D9RGB
Position Size Calculator thinkscript Code
If you prefer to create your own script in TOS and copy/paste the code, the script in its entirety is shown below. If you use the code in your own study, it would be appreciated if you keep the header comment with the links intact.
# Position Sizing Calculator
#
# Written by:  @JohnMuchow http://twitter.com/JohnMuchow
# Website:     PlayTheTrade.com
#
# v1.0
def aggregationPeriod = GetAggregationPeriod();
def lastPrice = close(priceType = PriceType.LAST);
#------------------------------------------
# Moving averages
#------------------------------------------
def _21DayMovingAverage = MovingAverage(AverageType.Exponential, close, 21);
def _50DayMovingAverage = MovingAverage(AverageType.Simple, close, 50);
def _10WeekMovingAverage = MovingAverage(AverageType.Simple, close, 10);
#------------------------------------------
# User input parameters
#------------------------------------------
input amtToRisk = 1000;
input portfolioSize = 100000;
input additionalPercentBelowMA = 0;
input movingAverage = {default "21-day EMA", "50-day SMA"};
#------------------------------------------
# Percent below MA and risk of equity
#------------------------------------------
def absOfAdditionalPercentBelowMA = AbsValue(additionalPercentBelowMA);
def riskAsPercentOfEquity = amtToRisk / portfolioSize;
#------------------------------------------
# Distance to the target stop price
#------------------------------------------
def targetPrice21Day = _21DayMovingAverage * (1 - absOfAdditionalPercentBelowMA/100);
def targetPrice50Day = _50DayMovingAverage * (1 - absOfAdditionalPercentBelowMA/100);
def targetPrice10Week = _10WeekMovingAverage * (1 - absOfAdditionalPercentBelowMA/100);
#------------------------------------------
# For the 21-day
#------------------------------------------
def costOfShares21Day = amtToRisk / (1 - (targetPrice21Day / lastPrice));
def numberOfShares21Day = costOfShares21Day / lastPrice;
def positionSize21Day = costOfShares21Day / portfolioSize;
def pricePercentFromStop21Day = (targetPrice21Day / lastPrice) - 1;
#------------------------------------------
# For the 50-day
#------------------------------------------
def costOfShares50Day = amtToRisk / (1 - (targetPrice50Day / lastPrice));
def numberOfShares50Day = costOfShares50Day / lastPrice;
def positionSize50Day = costOfShares50Day / portfolioSize;
def pricePercentFromStop50Day = (targetPrice50Day / lastPrice) - 1;
#------------------------------------------
# For the 10-week
#------------------------------------------
def costOfShares10Week = amtToRisk / (1 - (targetPrice10Week / lastPrice));
def numberOfShares10Week = costOfShares10Week / lastPrice;
def positionSize10Week = costOfShares10Week / portfolioSize;
def pricePercentFromStop10Week = (targetPrice10Week / lastPrice) - 1;
#------------------------------------------
# Output
#------------------------------------------
def daily = if (aggregationPeriod >= aggregationPeriod.DAY and aggregationPeriod < aggregationPeriod.WEEK, 1, 0);
AddLabel((movingAverage == movingAverage."21-day EMA" AND daily AND lastPrice > (_21DayMovingAverage * 1.02)), "Amt to risk: " + AsDollars(Round(amtToRisk, 0)) +  " ", if daily then CreateColor(234, 136, 52) else CreateColor(90, 122, 176));
AddLabel((movingAverage == movingAverage."50-day SMA" AND daily AND lastPrice > (_50DayMovingAverage * 1.02)), "Amt to risk: " + AsDollars(Round(amtToRisk, 0)) +  " ", if daily then CreateColor(234, 136, 52) else CreateColor(90, 122, 176));
AddLabel(!daily AND lastPrice > (_10WeekMovingAverage * 1.02), "Amt to risk: " + AsDollars(Round(amtToRisk, 0)) +  " ", if daily then CreateColor(234, 136, 52) else CreateColor(90, 122, 176));
AddLabel((movingAverage == movingAverage."21-day EMA" AND daily AND lastPrice > (_21DayMovingAverage * 1.02)), (if absOfAdditionalPercentBelowMA then absOfAdditionalPercentBelowMA+"% below" else "") + " 21-day as stop: "  + Round(costOfShares21Day / lastPrice, 0) + " shares (" + AsDollars(costOfShares21Day) + ") | Position size: " + AsPercent(positionSize21Day) + " | Risk as % of equity: " + AsPercent(riskAsPercentOfEquity) + " | % from stop: " + AsPercent(pricePercentFromStop21Day), Color.GRAY);
AddLabel((movingAverage == movingAverage."50-day SMA" AND daily AND lastPrice > (_50DayMovingAverage * 1.02)), (if absOfAdditionalPercentBelowMA then absOfAdditionalPercentBelowMA+"% below" else "") + " 50-day as stop: "  + Round(costOfShares50Day / lastPrice, 0) + " shares (" + AsDollars(costOfShares50Day) + ") | Position size: " + AsPercent(positionSize50Day) + " | Risk as % of equity: " + AsPercent(riskAsPercentOfEquity) + " | % from stop: " + AsPercent(pricePercentFromStop50Day), Color.GRAY);
AddLabel(!daily AND lastPrice > (_10WeekMovingAverage * 1.02), (if absOfAdditionalPercentBelowMA then absOfAdditionalPercentBelowMA+"% below" else "") + " 10-week as stop: "  + Round(costOfShares10Week / lastPrice, 0) + " shares (" + AsDollars(costOfShares10Week) + ") | Position size: " + AsPercent(positionSize10Week) + " | Risk as % of equity: " + AsPercent(riskAsPercentOfEquity) + " | % from stop: " + AsPercent(pricePercentFromStop10Week), Color.GRAY);
September 12, 2020 at 1:34 pm
Thomas Morgan sent in a code change that adds the stop value at the end of the display.
Change each of the AddLabel calls at the end of the script to include the stop information as shown below. Here is how the first AddLabel looks with the updated code:
AddLabel((movingAverage == movingAverage."21-day EMA" AND daily AND lastPrice > (_21DayMovingAverage * 1.02)), (if absOfAdditionalPercentBelowMA then absOfAdditionalPercentBelowMA+"% below" else "") + " 21-day as stop: " + Round(costOfShares21Day / lastPrice, 0) + " shares (" + AsDollars(costOfShares21Day) + ") | Position size: " + AsPercent(positionSize21Day) + " | Risk as % of equity: " + AsPercent(riskAsPercentOfEquity) + " | % from stop: " + AsPercent(pricePercentFromStop21Day) + " | Stop: " + Round(targetPrice21Day, 2), Color.GRAY);
Thanks Thomas!
September 13, 2020 at 3:27 pm
Thank you. This is great!
December 21, 2020 at 8:53 pm
Thanks everyone for your valuable contributions. I don’t mean to be firing up an old thread but would anyone mind helping me combine the two scripts mentioned above? I trie several variations and can’t seem to get it working right. Yes, I understand if it’s not far enough above the MA it won’t register. My issue is with combining johns code recommendations.
How hard would it be to add risk reward ratio in the data with a desired target entry and stop…?
I can do this in excel but really need to learn the think or swim scripts. Amazing work thanks again.
December 21, 2020 at 10:21 pm
If you are looking to add the stop value at the end of the code, try replacing the last three AddLabel commands with the following:
AddLabel((movingAverage == movingAverage.”21-day EMA” AND daily AND lastPrice > (_21DayMovingAverage * 1.02)), (if absOfAdditionalPercentBelowMA then absOfAdditionalPercentBelowMA+”% below” else “”) + ” 21-day as stop: ” + Round(costOfShares21Day / lastPrice, 0) + ” shares (” + AsDollars(costOfShares21Day) + “) | Position size: ” + AsPercent(positionSize21Day) + ” | Risk as % of equity: ” + AsPercent(riskAsPercentOfEquity) + ” | % from stop: ” + AsPercent(pricePercentFromStop21Day) + ” | Stop: ” + Round(targetPrice21Day, 2), Color.GRAY);
AddLabel((movingAverage == movingAverage.”50-day SMA” AND daily AND lastPrice > (_50DayMovingAverage * 1.02)), (if absOfAdditionalPercentBelowMA then absOfAdditionalPercentBelowMA+”% below” else “”) + ” 50-day as stop: ” + Round(costOfShares50Day / lastPrice, 0) + ” shares (” + AsDollars(costOfShares50Day) + “) | Position size: ” + AsPercent(positionSize50Day) + ” | Risk as % of equity: ” + AsPercent(riskAsPercentOfEquity) + ” | % from stop: ” + AsPercent(pricePercentFromStop50Day) + ” | Stop: ” + Round(targetPrice50Day, 2), Color.GRAY);
AddLabel(!daily AND lastPrice > (_10WeekMovingAverage * 1.02), (if absOfAdditionalPercentBelowMA then absOfAdditionalPercentBelowMA+”% below” else “”) + ” 10-week as stop: ” + Round(costOfShares10Week / lastPrice, 0) + ” shares (” + AsDollars(costOfShares10Week) + “) | Position size: ” + AsPercent(positionSize10Week) + ” | Risk as % of equity: ” + AsPercent(riskAsPercentOfEquity) + ” | % from stop: ” + AsPercent(pricePercentFromStop10Week) + ” | Stop: ” + Round(targetPrice10Week, 2), Color.GRAY);