


I’m a huge fan of Investors.com MarketSmith charting application. Their implementation of a Relative Strength Line (RS Line) is my go-to indicator.
In MarketSmith, the RS Line represents a stock’s performance versus the S&P 500. If you are looking at a weekly chart, the RS Line is the performance of the stock over the past week versus the S&P 500 over that same time frame. The same logic applies to the daily and monthly charts, only the time frames are different.
If a stock moves up for the day/week/month and the S&P 500 does not, the RS Line will move up. If a stock ends the day/week/month flat, yet the S&P 500 moves up, the RS Line will go down.
I use TradingView as a means to create my own indicators through their scripting language, Pine Script. With my fondness of the RS Line in MarketSmith, I thought I’d share an RS Line indicator for other TradingView users.
Latest Release Notes
Head over to TradingView to install the latest release of the RS Line indicator .
Version 7 of the RS Line now includes the following features:
■ Draw most recent high based on your preferred look-back range
■ Set color preferences for RS Line
■ Visual callout to show RS Line at new high
■ Configurable callout shape and color
MarketSmith RS Line
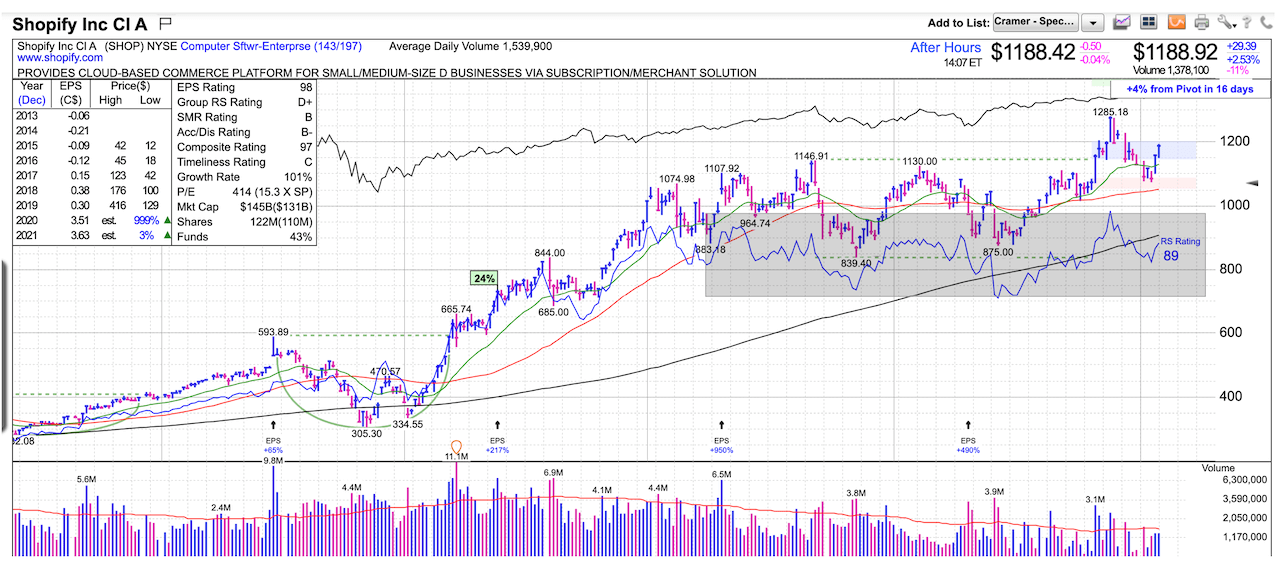
One primary goal was to create an indicator with a similar look and feel as the RS Line in MarketSmith. Here’s a screenshot of Shopify (SHOP) with the RS Line shown in the gray box:
Compare and contrast the chart above to the RS Line indicator for TradingView:
RS Line Customizable Settings
I’ve added two features to my custom RS Line script. First, I added an option to show the RS Line with colors that indicate the direction of each move.
Second, the RS Line can be moved up/down on the chart. This can be helpful based on the resolution you are viewing (daily, weekly, etc).
RS Line – Live in TradingView
You can find the RS Line on my PlayTheTrade profile in the scripts area of TradingView.
The chart below is a live view of the RS Line in TradingView.