


The idea and calculations for the Volume Positive Negative (VPN) indicator were created by Markos Katsanos. Markos wrote about the indicator in the article Detecting High-Volume Breakouts, published in Technical Analysis of Stocks & Commodities April, 2021 (Vol. 39, Issue 5).
The goal of the VPN indicator is to detect breakouts using only volume. The basic idea is to compare volume on up days versus volume on down days. The oscillator can move between the range of -100 and 100. Values between 0 and 20 are generally considered bullish, negative are bearish.
When the plotted VPN crosses over what Markos refers to as the critical value, that may indicate a high volume breakout. The critical value can be adjusted between 0 to 20, 10 is the default,
Free Trial: If you haven’t tried the TradingView charting app, you owe it to yourself to give their free trial a spin. You won’t regret it!
Here’s where you can find the latest release of the Volume Positive Negative (VPN) indicator.
Volume Positive Negative (VPN) Formula
VPN = (VP - VN) / MAV / Period * 100
VP - sum of positive volume
VN - sum of negative volume
MAV - moving average of volume
Volume is considered positive when the average price is higher than the previous day’s price by more than .1 of the ATR (average true range). The opposite is true for negative.
VPN Examples
The results of a test case by Markos is shown below. The reference to “40” in VPN 40 indicates that the period length is set to 40.
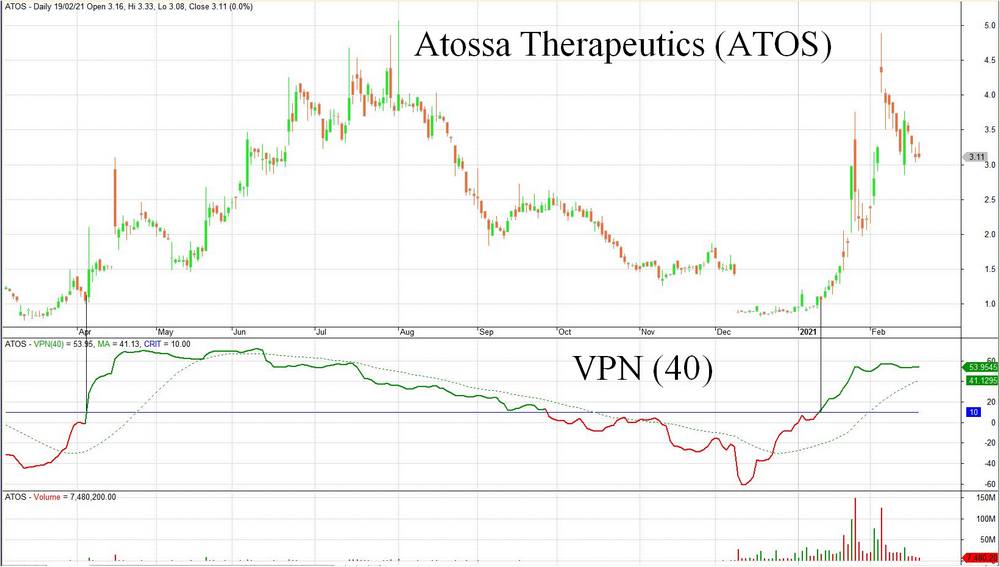
The TradingView VPN indicator shows similar results for the same stock:
Another example of the VPN indicator follows, this time with the period set to the default of 30: